Gandak floods spread downstream as satellite images reveal the scale of inundation
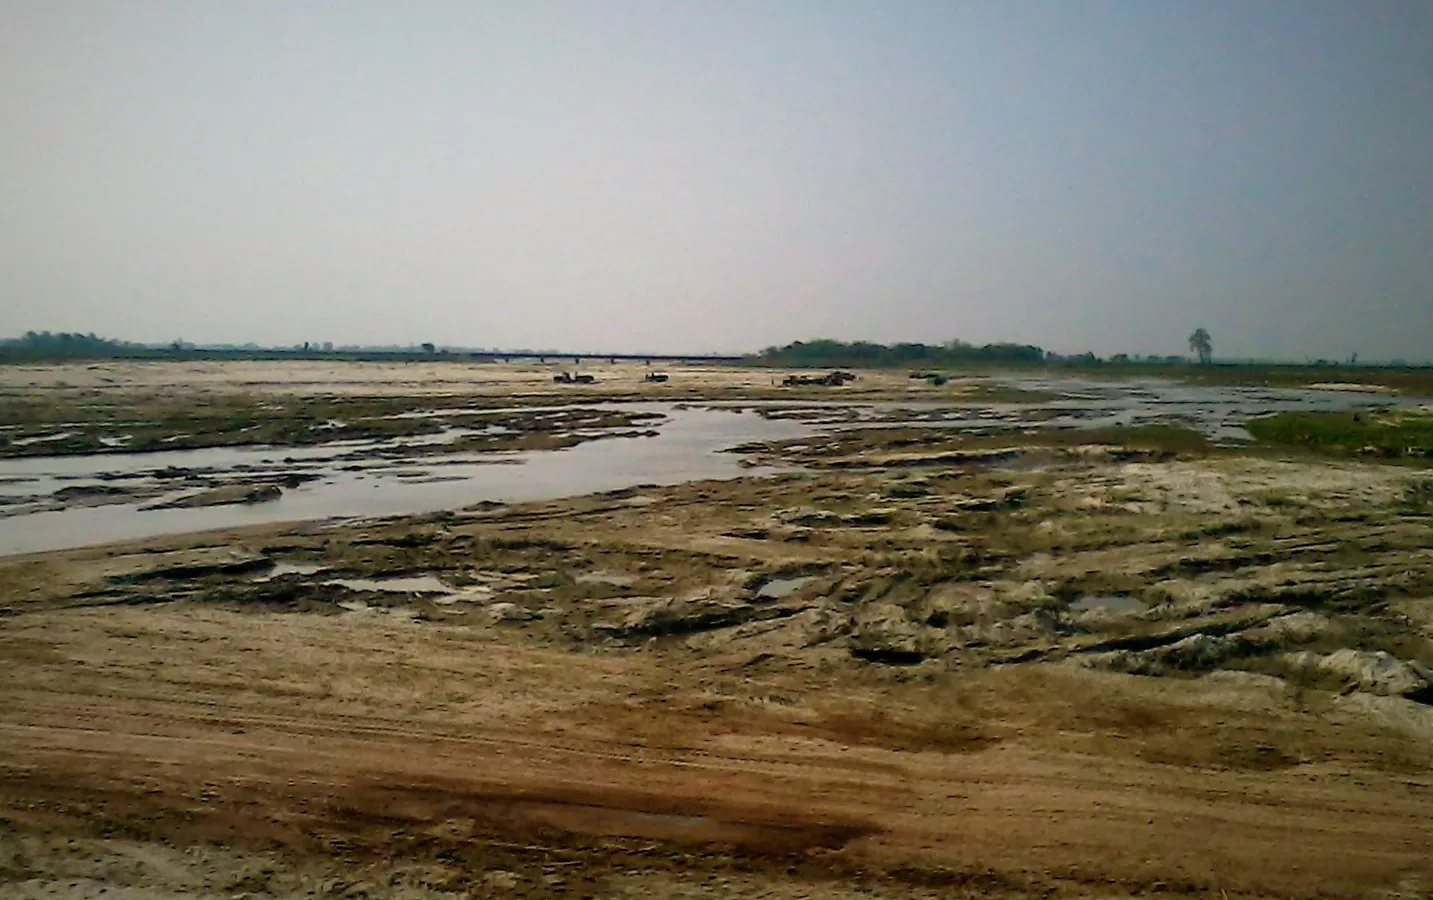
Late-monsoon rain sent water across farmland and settlements in Nepal and India.
Satellite images show the Gandak River spilling far beyond its earlier course after late-monsoon rain, putting a regional flood emergency across Nepal and India into a single view.
NASA's October 2 assessment compares observations from September 20 and September 29. In the later image, water occupies a much broader area after storms struck Nepal's Lumbini and Gandaki provinces between September 24 and 27.
The river, also known as the Narayani in Nepal, carried the effects downstream. NASA described embankments overtopping or breaching and water spreading through farmland and settlements along hundreds of kilometers of the river system.
The images document inundation, while reports from the ground show the pressure on flood defenses. The Indian Express reported a breach in the Gandak embankment at Bagaha on September 28 and high alerts in districts of Bihar and Uttar Pradesh. It cited Bihar's water-resources department as recording a discharge of 543,500 cubic feet per second at the Valmikinagar barrage the following morning.
That report said discharge remained above 500,000 cubic feet per second for 13 hours. Such sustained flows help explain why the impact cannot be understood solely as rain falling over the villages that eventually flood: water arriving from the upstream catchment continues moving through the system.
The Gandak flooding formed part of a wider disaster. Reuters reported September 27 that floods and landslides had killed 56 people in India and 14 in Nepal, according to authorities. Those were regional totals, not a death toll established for the Gandak alone. The agency also reported power and telecommunications disruption in Nepal.
Keeping the scales separate matters. A river image can show where water spread on a particular day, but it cannot establish how many people were inside affected buildings or whether a road remained usable beneath shallow water. Conversely, a national casualty count cannot be assigned to every flooded district.
NASA's false-color comparison is useful because it places the river before and after the intense rainfall side by side. Its acquisition date is September 29, even though the agency published the assessment three days later. It is a record of that phase of the disaster rather than a live map of conditions.
The reporting points to overlapping recovery needs: protecting residents near damaged embankments, determining the extent of agricultural losses and restoring services interrupted by flooding and landslides. Authorities were still assessing damage as the week closed.
For communities downstream, the sequence demonstrates how a burst of mountain rainfall can become a prolonged lowland emergency. The satellite perspective supplies the scale; local assessments are needed to establish the consequences street by street and field by field.